
Give to the Max Day is happening RIGHT NOW.

It’s a day of charitable giving run by by givemn.org, which offers several financial incentives to inspire nonprofit, school and donor participation in Give to the Max Day.
So…
Give to the Max Day is happening RIGHT NOW.
It’s a day of charitable giving run by by givemn.org, which offers several financial incentives to inspire nonprofit, school and donor participation in Give to the Max Day.
So…
On the drive back from Omaha, Nebraska I was listening to the Skeptically Speaking podcast episode #163 “Newton and the Counterfeiter“. The discussion turned at one point toward the purpose and meaning of money, and what money is supposed to do for us and for a society. I came up with a thought. Okay, a couple of thoughts. I’m not sure that I agree with them, but I had ’em:
The purpose of money is to keep human greed in check –>
Humans often seem to want more than what we have (exceptions: those who eschew money – vows of poverty, e.g.). Money is a way to balance what we want with what we can have.
If everybody wants everything but there’s nothing to create at least an illusion of fairness about who gets what, we have problems.
I will define fairness in this case as meaning that people get things proportional to what they earn. I will go further to suggest that one can only earn fairly if the contributions somehow – however indirectly – benefit the larger society.
I swear upon Sagan that I wasn’t high or drunk when I was thinking about this.
It’s probably obvious that I haven’t studied economics or financial systems; I have a feeling the questions I’m toying with are very basic concepts. And I understand that because I’m a prosocial person, that colors my thoughts about ideas of fairness, equality and equity.
So I thought I’d ask you folks if you’ve given this topic of the purpose of money any thought. Let’s hash it out, puzzle out how greed, money, motivation all fits together, and then get our asses off this rock and out amongst the stars.* Which reminds me – how did they do away with money in Star Trek? What drives innovation and motivation in that universe?
*************************
*Or you could leave me babbling to myself in the corner here. That happens sometimes. Don’t pity me. I’m awesome. You don’t know me!
I drink Diet Coke. I like the way it tastes and I like the carbonation. Recently I started drinking Diet Caffeine-Free Coke because I’m trying to cut back on the caffeine. And I’ll drink Pepsi, especially if it’s on sale. But the point is, I drink soda and when I do it’s usually Coke products.
A few years ago I took notice of this whole Coke Rewards program. For those of you who aren’t familiar with the concept, inside the cap of every bottle of Coke, and inside the cardboard or plastic packaging of every case of Coke, there is a long alphanumeric code. If you sign up for a free account at mycokerewards.com you can enter these codes and get anywhere from 3-25 points per code. The codes add up and you can use them to buy things from the mycokerewards catalog, enter drawings for really big prizes, or donate the points to charity groups for their use.
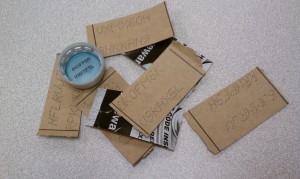
I decided to start playing, and I became one of those crazy coworkers or friends who sees you drinking your soda and asks, “Can I have your cap when you’re done with your Coke?” I’ve also been known to troll the workplace birthday/ anniversary/ shower/ retirement parties for the empty Coke cases so I can get points there.
The way the entry system works is this: You can enter up to 120 points per week; the count resets every Monday. When you see something on the website that you want to buy, you simply click on it, mycokerewards.com deducts the points from your account, and the prize is shipped to your address in 6-8 weeks. Items range in price from 3-2000 points.

Screen capture from mycokerewards.com – click image to follow to source.
Recently I purchased two 2-packs of AMC tickets plus popcorn and drinks. These cost me 1100 points each. I got to thinking about the math behind this, and was tickled by the numbers so I thought I’d share.
So:
That’s a lot of Coke!
Coke gets their marketing – They know that I’m interested in their product over long periods of time because I continue to enter codes, they get to bombard me with advertisements when I visit the rewards website, and they get to track the kind of things I buy so they can better market to me in the future. In turn, I receive a free night at the movies with a friend. Like I said in the first paragraph, I drink the stuff anyway. I’m not buying Coke in order to collect points. I don’t buy more Coke than I would if there wasn’t a rewards program in place, and we still buy Pepsi if it’s cheaper than Coke on any given week.
I participate in several loyalty programs besides the Coke Rewards. I’ve got a handful of those little keyfob cards on my keyring: Sally Beauty Club, SuperAmerica Speedy Rewards, PetCo P.A.L.S, PetSmart PetPerks, AMC Stubs. I feel like I get free stuff for using these cards at places that I go anyway, but is the cost of me giving these companies so much information and ways to sell me more stuff worth it in the long run?
How do you feel about perk/loyalty/reward programs?
These statistics predict….more money than last election term.
This graph came out of the Washington Post. It is called a Bartels Chart (Larry Bartels is a political scientist and author of several books), and it was shown on the Rachel Maddow Show.
Income percentile – This is roughly how much money you make compared to the rest of Americans. If you’re in the 95th percentile, you make a LOT. If you’re in the lower 20th, you don’t make as much.
Income Growth Rate – This is how much more or less money you make over some time or event.
Another way to look at this data is this:

I found this chart on Dani Rodrik’s weblog American political economics in one picture. In his article he explains the chart and its implications.
When a Republican president is in power, people at the top of the income distribution experience much larger real income gains than those at the bottom–a difference of 1.5 percent per year going from the bottom to the top quintile in the income distribution. The situation is reversed when a Democrat is in power: those who benefit the most are the lower income groups.
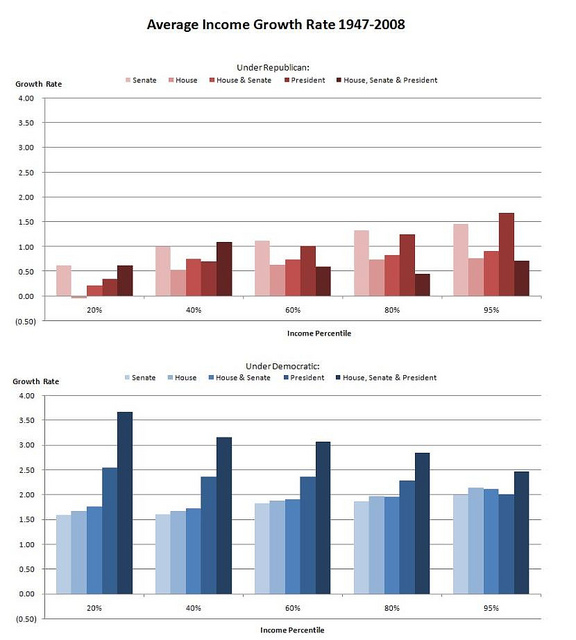
And then I found this graph on the Rachel Maddow Show Blog. It goes a few steps further than the first two Bartel’s charts because it breaks the data down into President and Congressional majorities.
This graph shows the average income growth rate on the y-axis and the income percentile on the x-axis. Each bar of the graph describes growth under either a Republican majority
Under a Republican majority of ANY of these groups, the income percentile on the right (i.e., the richest Americans) usually experienced the largest growth rate over all other brackets. The exception appears to be when a Republican President is governing with a Democratic majority in both the House and Senate.
The second graph (blue) shows that when there’s a Democrat President plus a Democrat majority in the House and/or Senate, the income percentile on the left (i.e., the poorest Americans) experience the largest growth rate over all other brackets. ALSO, when ANY Democrat majority holds sway in the House or Senate or White House, EVERYONE has at least a 0.5 positive growth rate over any Republican majority.
These statistics predict….more money than last election term.
This graph came out of the Washington Post. It is called a Bartels Chart (Larry Bartels is a political scientist and author of several books), and it was shown on the Rachel Maddow Show.
Income percentile – This is roughly how much money you make compared to the rest of Americans. If you’re in the 95th percentile, you make a LOT. If you’re in the lower 20th, you don’t make as much.
Income Growth Rate – This is how much more or less money you make over some time or event.
Another way to look at this data is this:
I found this chart on Dani Rodrik’s weblog American political economics in one picture. In his article he explains the chart and its implications.
When a Republican president is in power, people at the top of the income distribution experience much larger real income gains than those at the bottom–a difference of 1.5 percent per year going from the bottom to the top quintile in the income distribution. The situation is reversed when a Democrat is in power: those who benefit the most are the lower income groups.
And then I found this graph on the Rachel Maddow Show Blog. It goes a few steps further than the first two Bartel’s charts because it breaks the data down into President and Congressional majorities.
This graph shows the average income growth rate on the y-axis and the income percentile on the x-axis. Each bar of the graph describes growth under either a Republican majority
Under a Republican majority of ANY of these groups, the income percentile on the right (i.e., the richest Americans) usually experienced the largest growth rate over all other brackets. The exception appears to be when a Republican President is governing with a Democratic majority in both the House and Senate.
The second graph (blue) shows that when there’s a Democrat President plus a Democrat majority in the House and/or Senate, the income percentile on the left (i.e., the poorest Americans) experience the largest growth rate over all other brackets. ALSO, when ANY Democrat majority holds sway in the House or Senate or White House, EVERYONE has at least a 0.5 positive growth rate over any Republican majority.